
How are we getting on with school suspensions (also known as exclusions)?
Here are ten key points from the latest Department for Education (DfE) annual data on school suspensions (published in July 2023).
There are 8.3 million pupils in England’s schools and they all form part of the data.
Graphs show “What percent of pupils were suspended at least once?”
1. School Suspensions are higher than pre-Covid levels
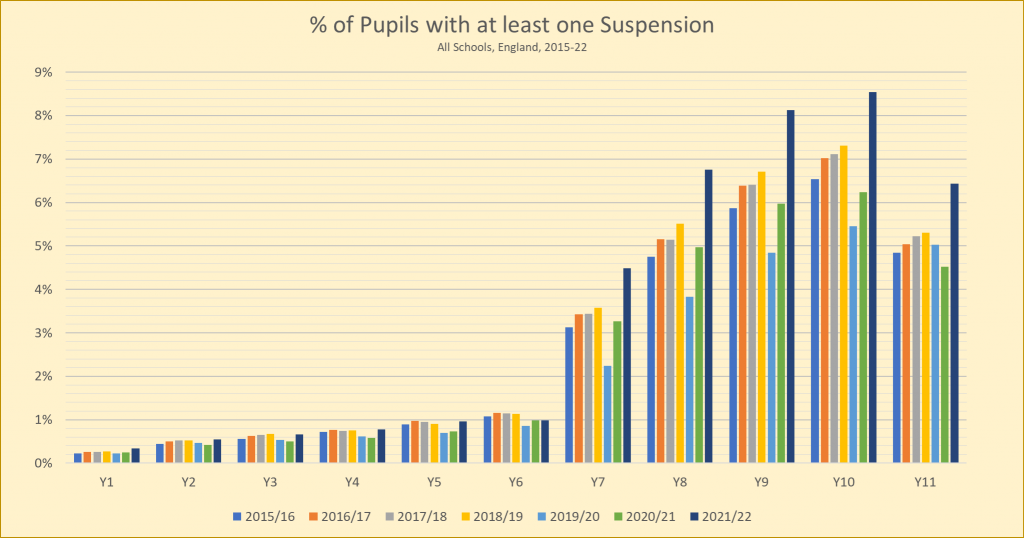
Yes. The pandemic saw a decline in suspensions. That’s not unexpected because there were fewer pupils in school. So, it is better to compare the latest figures with pre-Covid stats. Such a comparison shows that rates have passed pre-Covid levels in both primary and secondary.
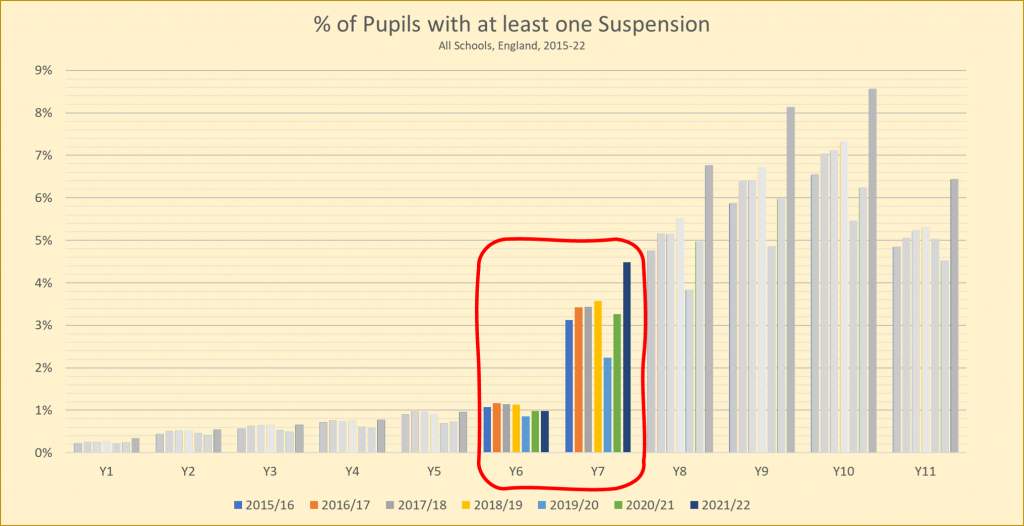
The rise in suspensions from Y6 to Y7 is big: Four times as many Y7s are suspended than Y6. There are probably many factors behind this. Great care should be taken to avoid oversimplifying complex issues, but for information, here are a few possible ideas:
- A more academic curriculum
- Some secondaries have high suspension rates due to their very strict school rules.
- Settling (or not) into new peer groups
- We aren’t identifying all SEND needs and this can lead to challenging behaviour etc…
The above list could be a very long one.
2. A stark rise in secondary pupils suspended since pre-Covid
We can’t yet know if the steep rise in secondary pupils who are suspended is a blip (e.g. to address challenging behaviour post-Covid) or an ongoing trend. The Department for Education take 11 months from the end of a school year to release the data, so we will only begin to know if it is a blip or trend in July 2024.
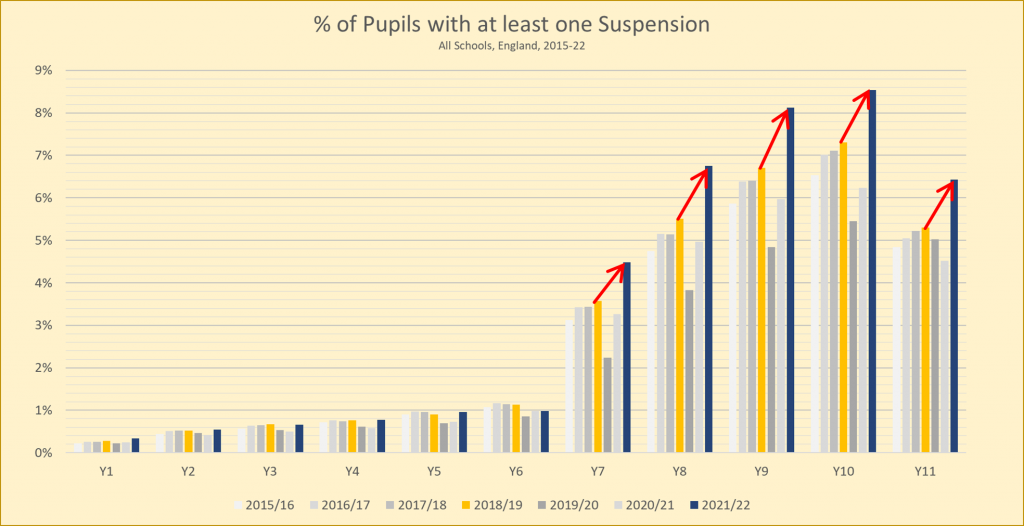
However, it is clear that the rise means an extra 60,000 secondary pupils were suspended in the latest year vs 2018/19.
If ‘zero-tolerance’ policies work, should we now see suspensions level off in secondaries (as the policy improves behaviour)? This is a pertinent question given that we now suspend 1 in 12 of our Y9 pupils.
It’s also true that there has been a rise in the percentage of primary pupils who were suspended compared to pre-Covid. This is an 8% rise (0.63% in 2018/19 to 0.68% in 2021/22). Primary suspension rates seem to be on an upward trend but it’s hard to be sure yet. What is certain is that the latest primary suspension rates are the highest for 16 years.
3. Boys, Girls & School Suspensions
Yes, boys make up more of our suspensions than girls. But, look how the orange section changes between primary and secondary.
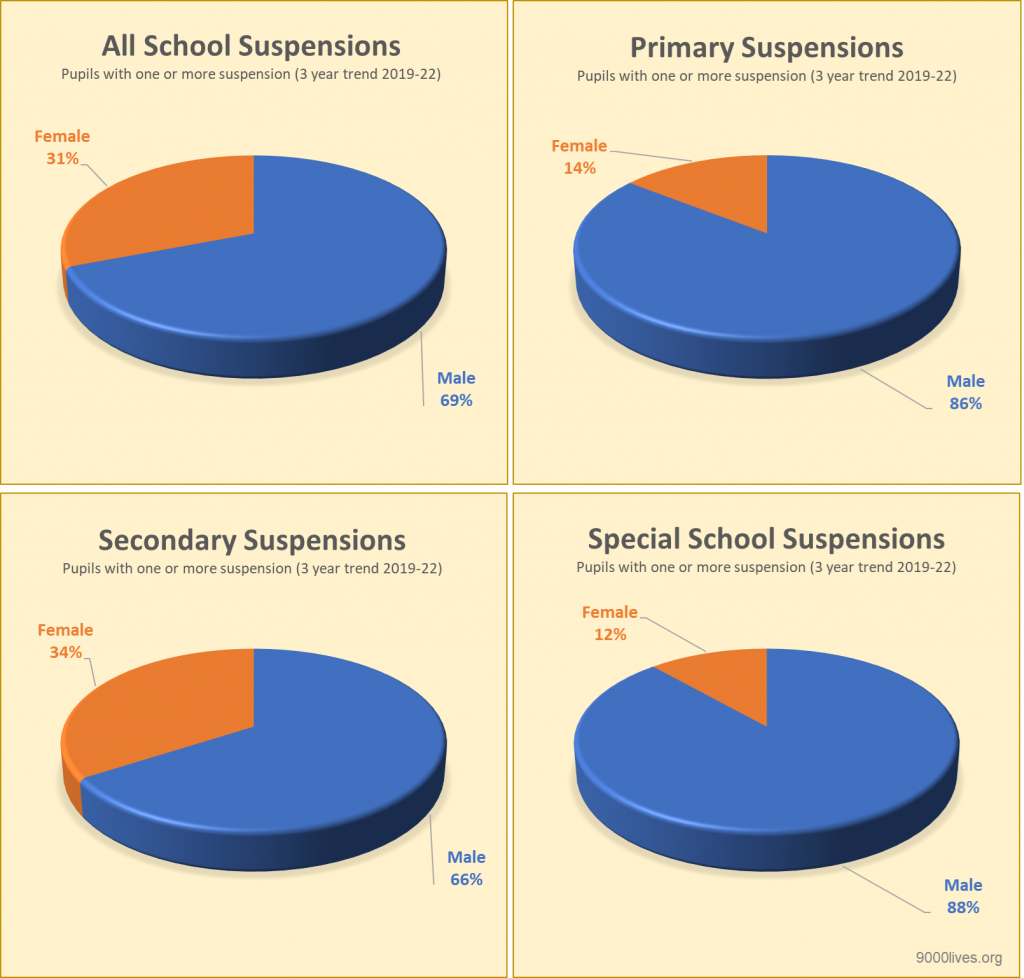
There must be reasons for the change between primary and secondary. However, without digging deep into DfE data (reasons for suspensions of boys vs girls), it is impossible to explain here.
Special Schools are less clearly skewed in favour of excluding boys. That’s because over 70% of the pupils in England’s special schools are boys. If there are more boys in a school, then it’s no surprise that more boys are suspended.
Furthermore, boys make up 85% of our special school pupils with SEMH (SEMH is the SEND that gets suspended most). So, not only are there more boys in total, schools for SEMH pupils are very male dominated.
4. Ethnicity & School Suspensions
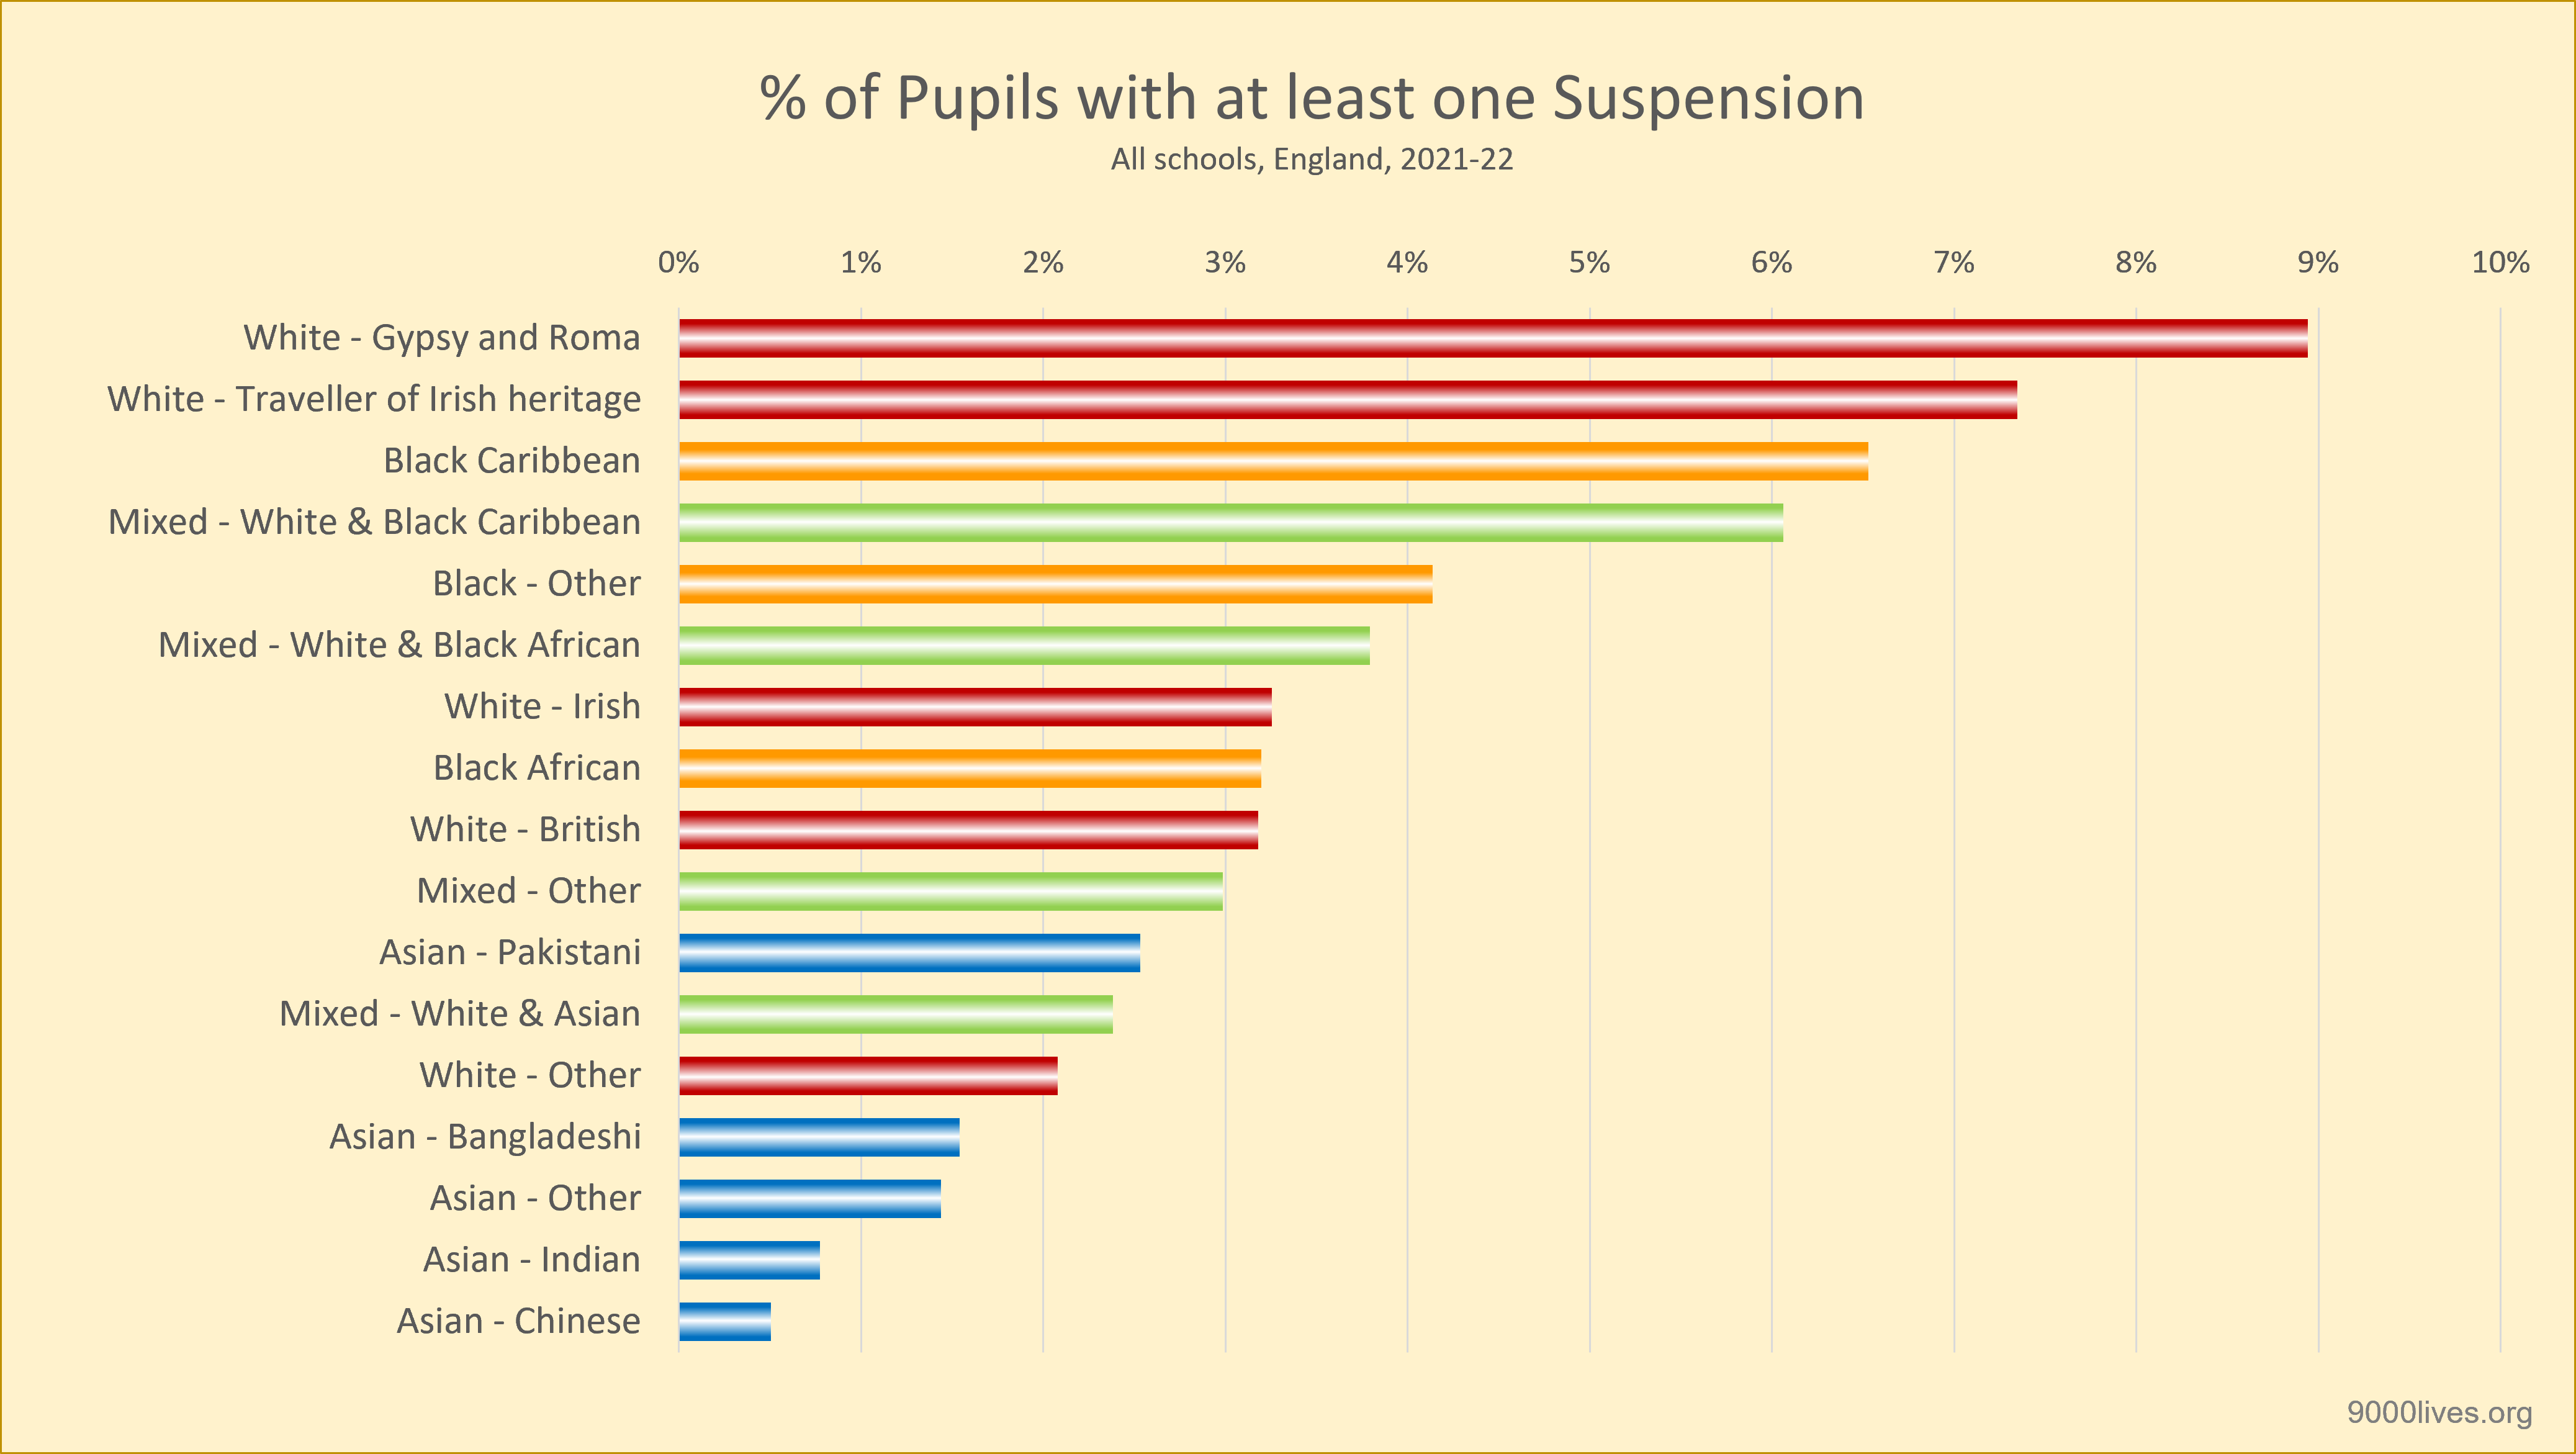
Gypsy and Roma pupils are those most likely to have been suspended. This is ironic given that
a) some of this group withdraw from secondary (where suspension rates are higher) and,
b) this group has lower attendance anyway.
Sadly, this isn’t new. Ofsted had concerns about Gypsy & Roma exclusions in 1996! Over 25 years later, that concern lives on.
Tackling this is difficult. There are less than 30,000 Gypsy and Roma pupils in our 24,000 schools, and they are not evenly distributed. Therefore, some schools will have no pupils who are Gypsy or Roma. Where they do have Gypsy or Roma pupils, schools can help if they build strong relationships with the pupils and their families, address learning gaps and support the development of strong friendships.
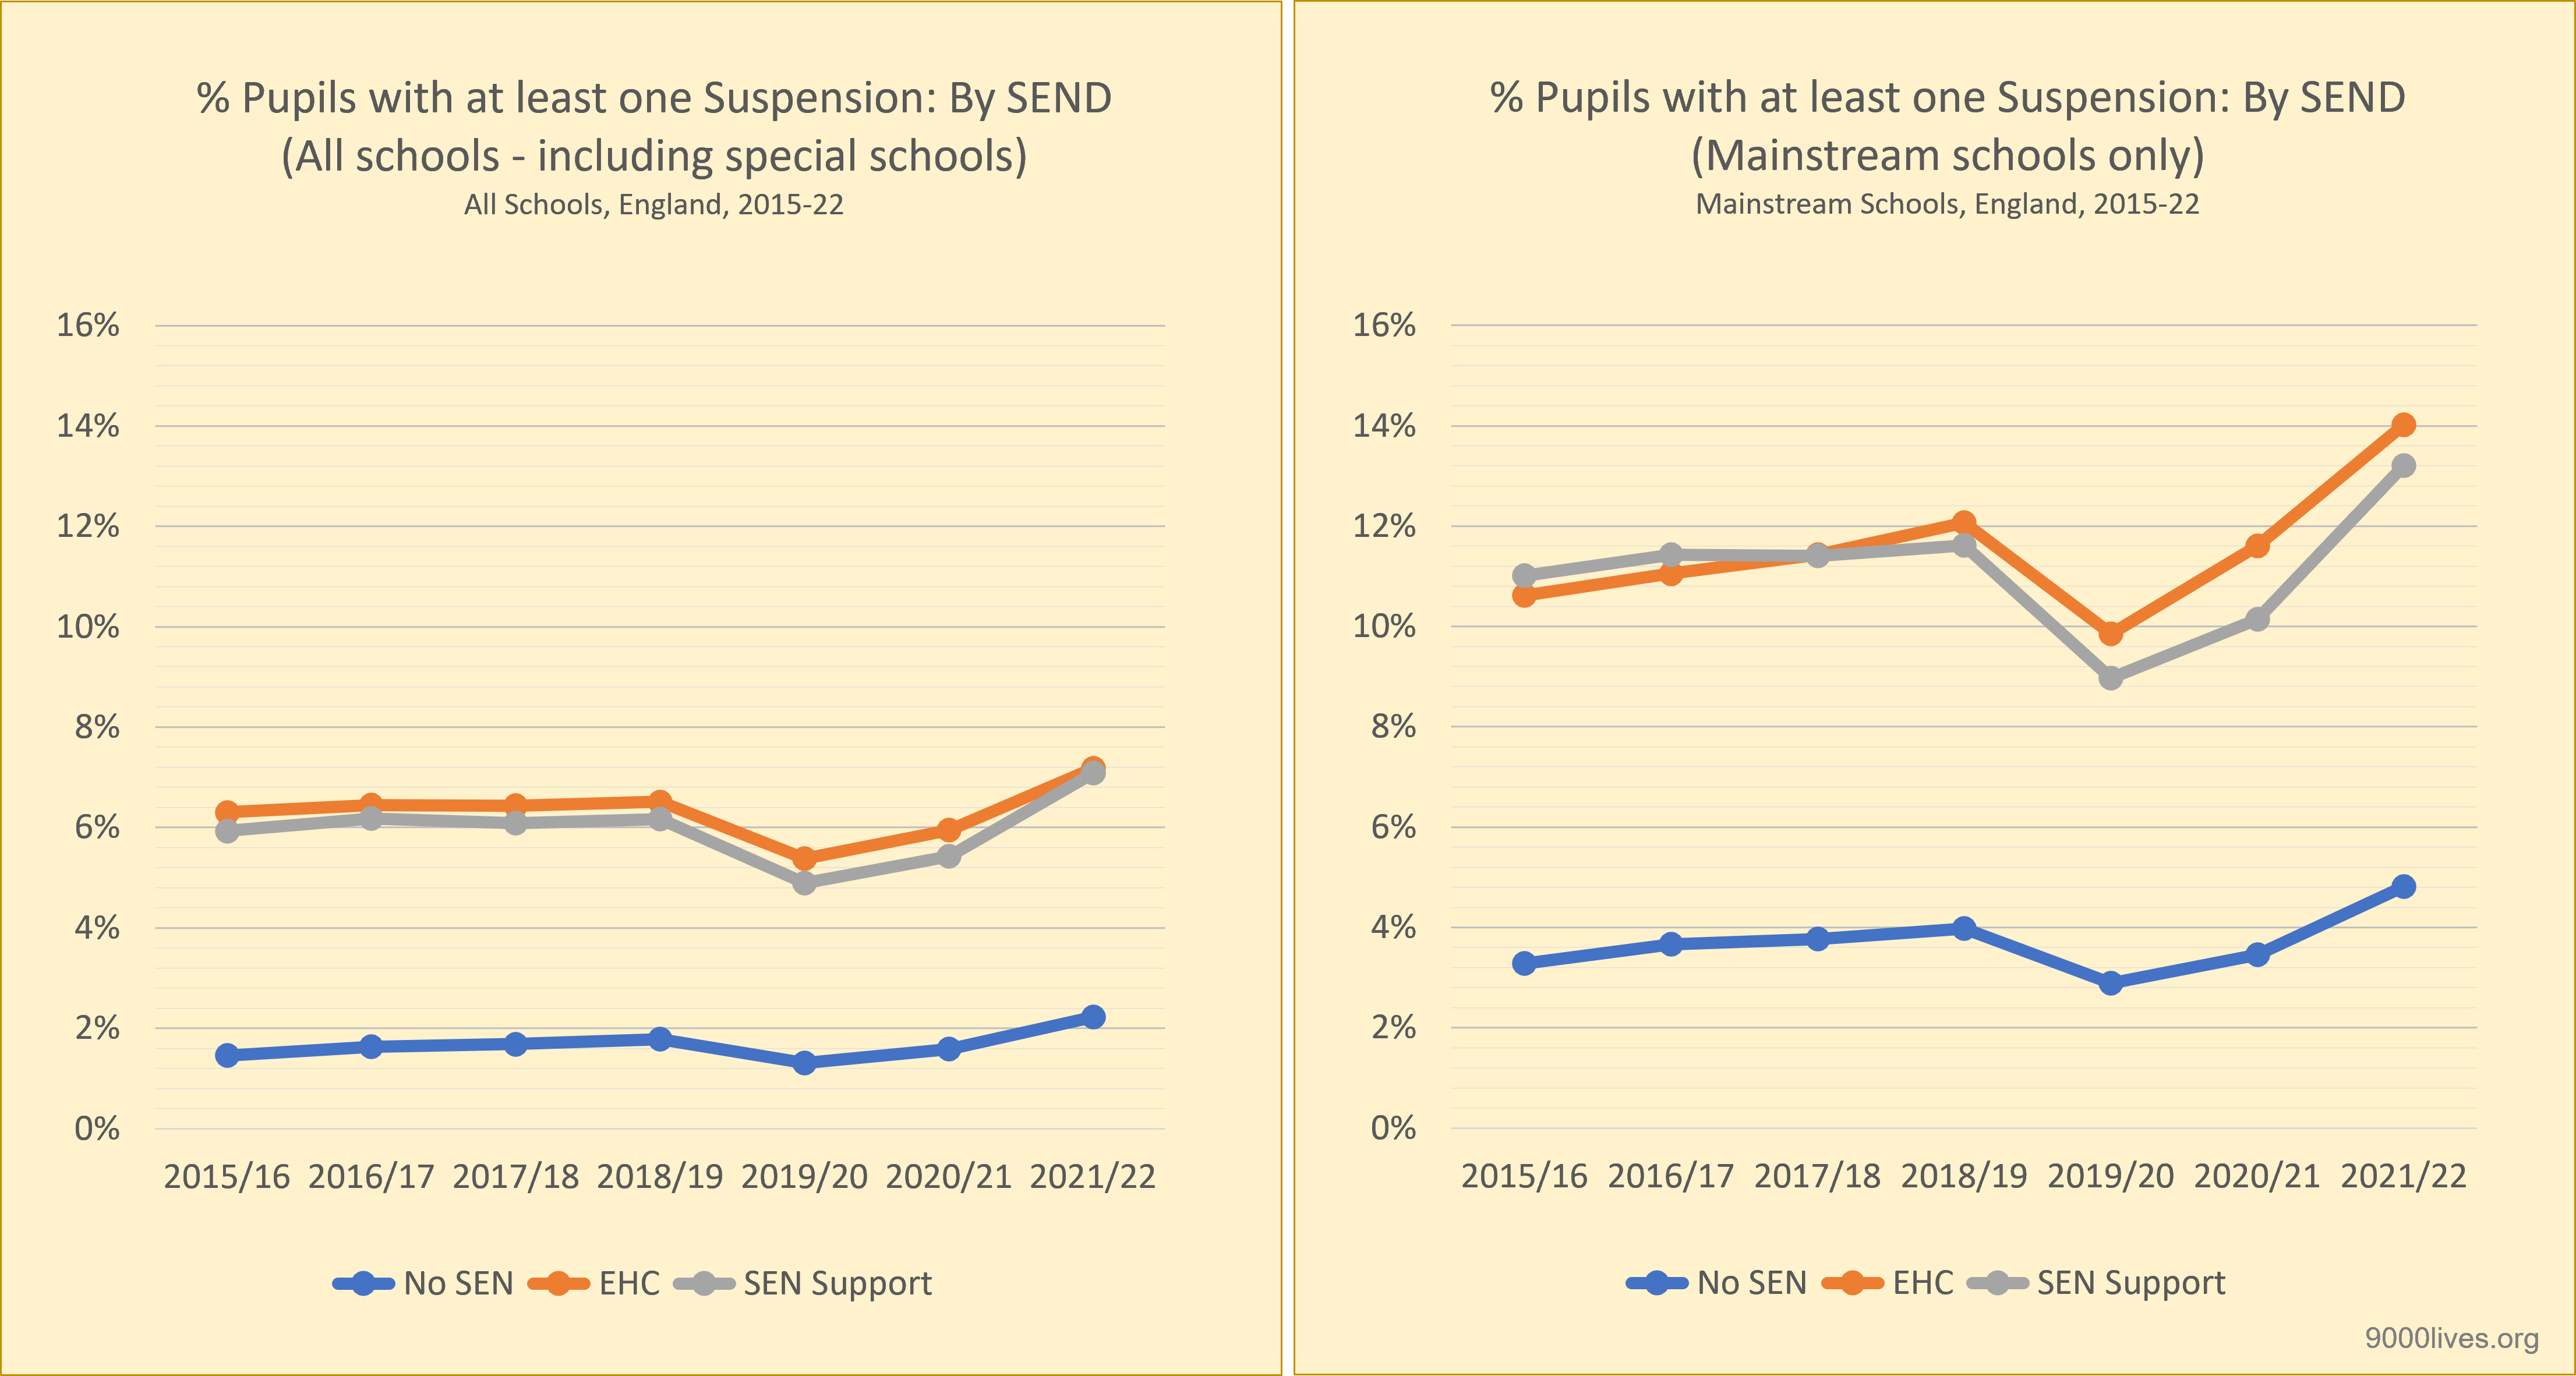
5. SEND & School Suspensions
Yep – you guessed it… We have lots more to do here:
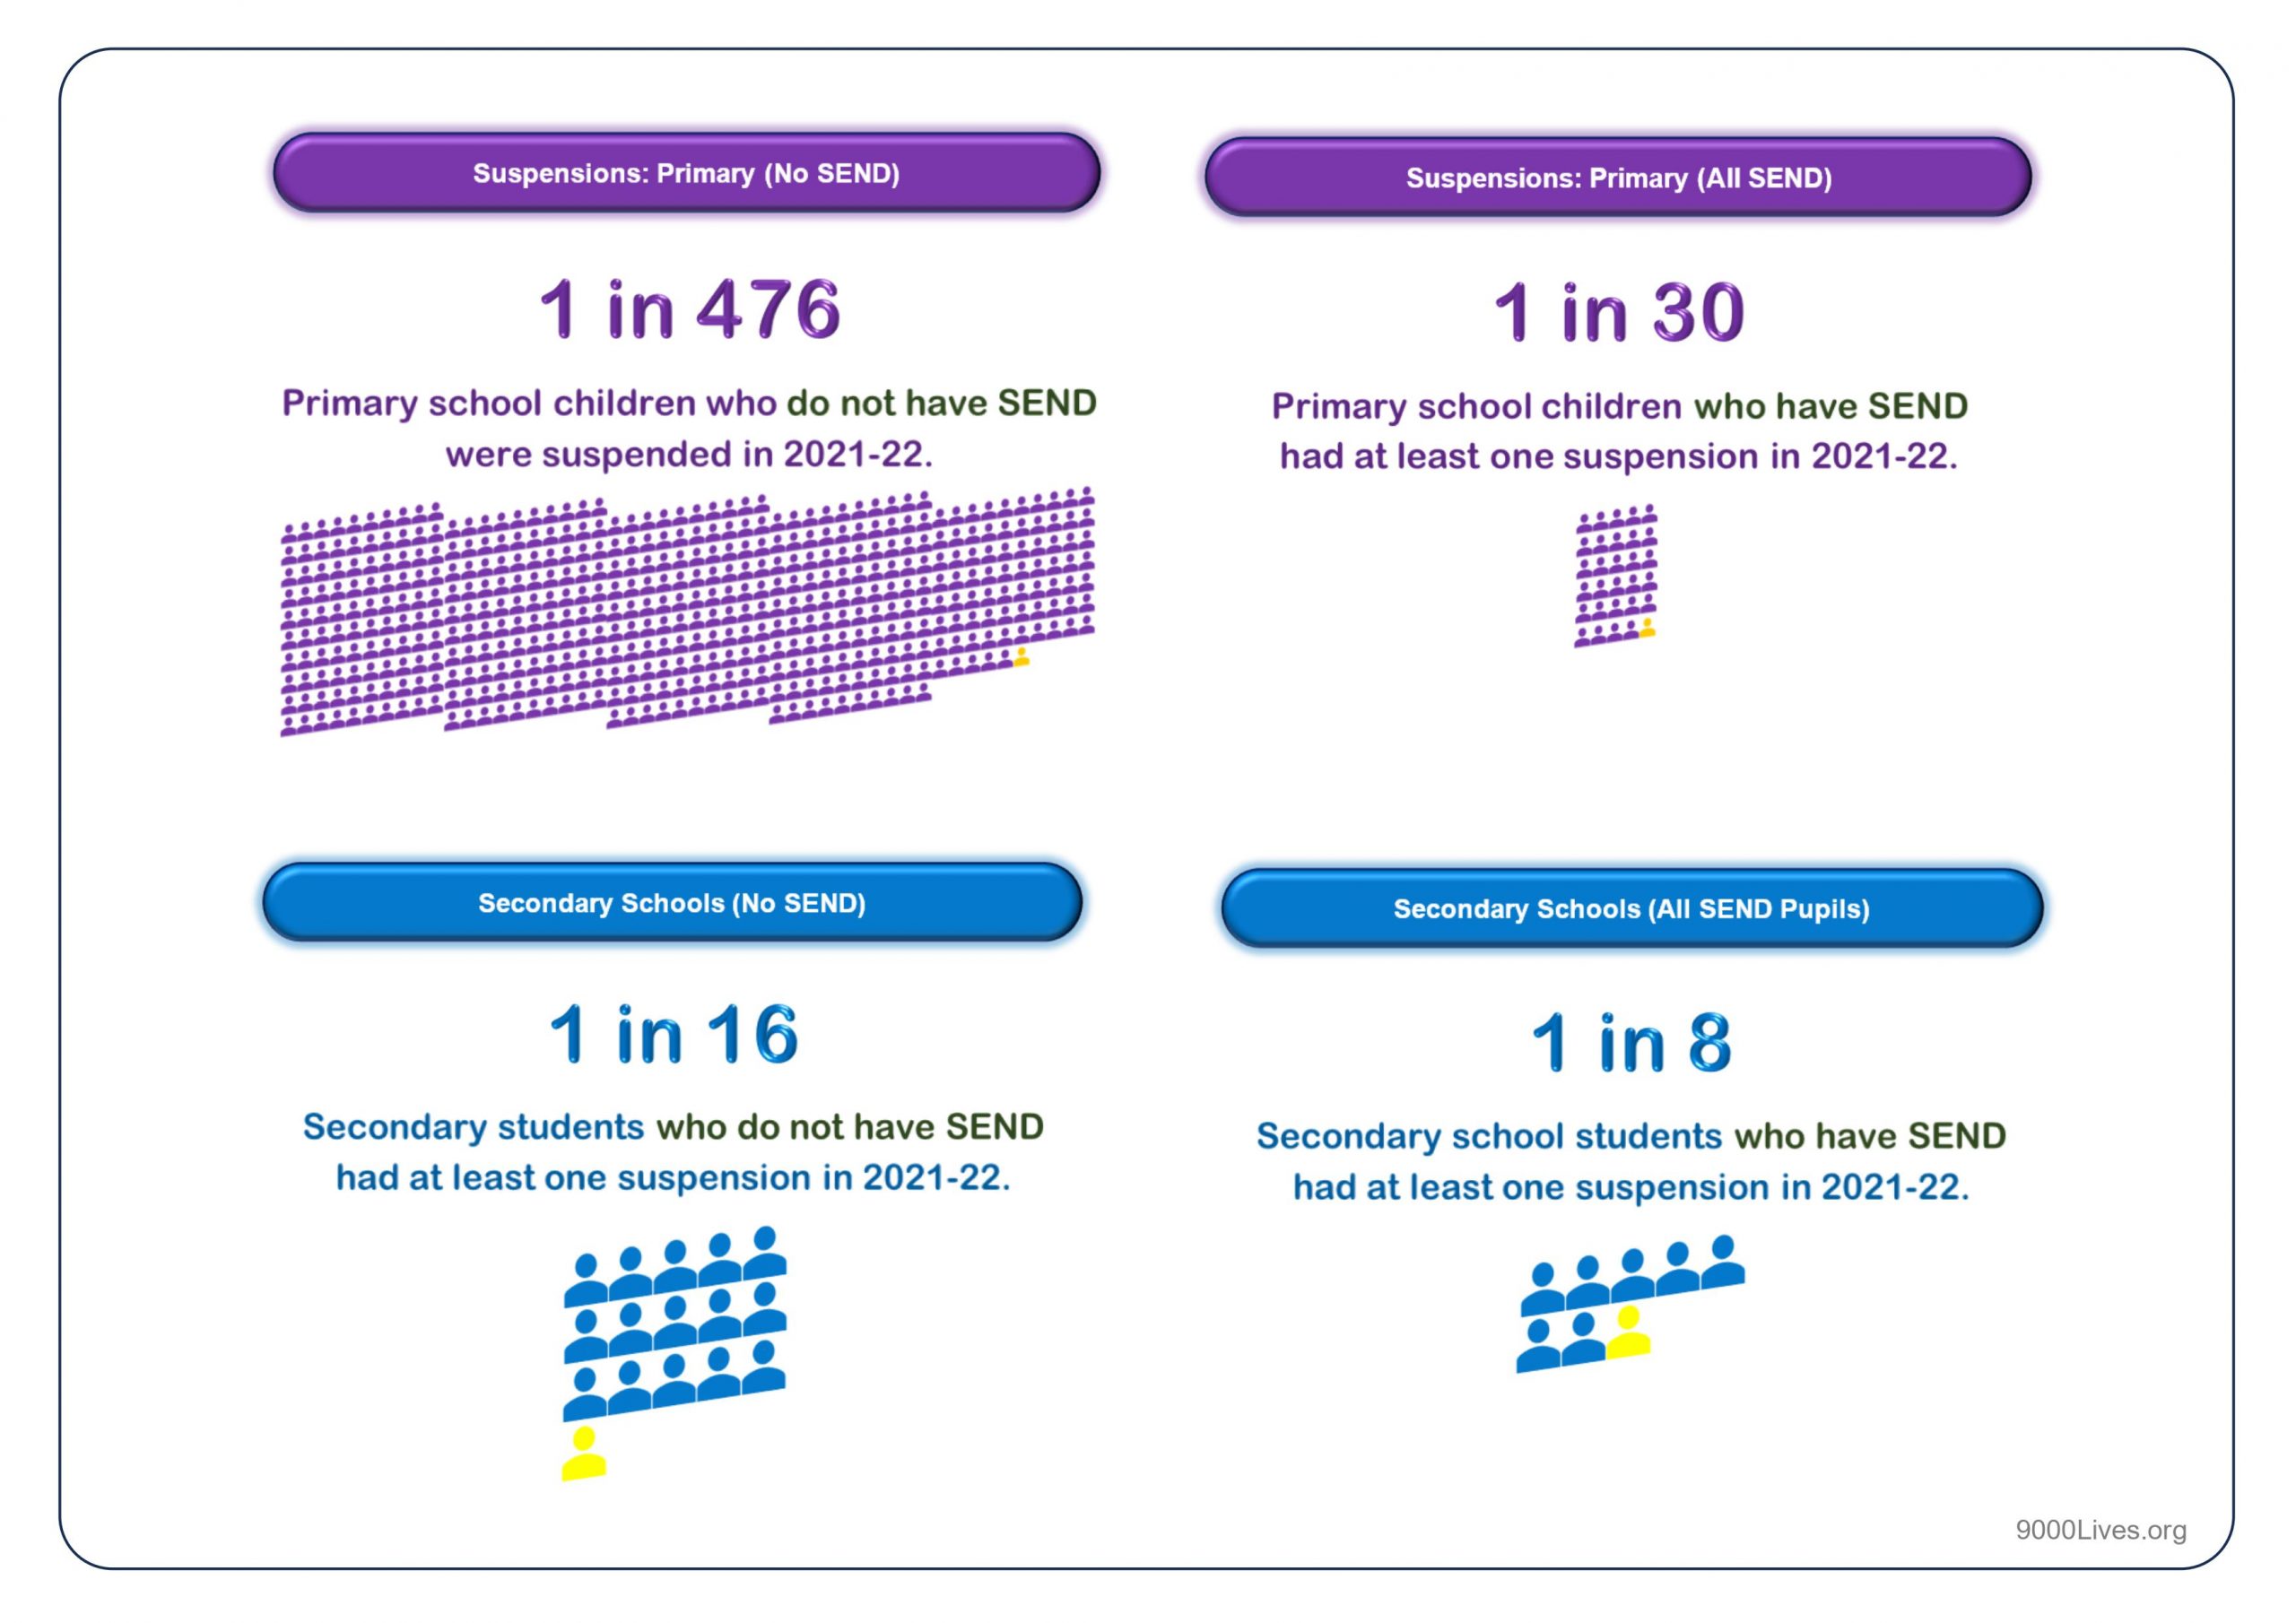
When we look at the level of SEND, there’s not much difference between SEND pupils with an EHCP vs those at SEND support. That’s still the same when you omit the special school data (where 43% of our 360,000 EHCP pupils are educated and rates of suspension are lower than mainstream secondary).
6. Free School Meal Eligibility & School Suspensions
Pupils who are eligible for free school meals make up a disproportionate percent of our suspended pupils.
More broadly, household income appears linked to how likely a pupil will be suspended (even in more advantaged households).
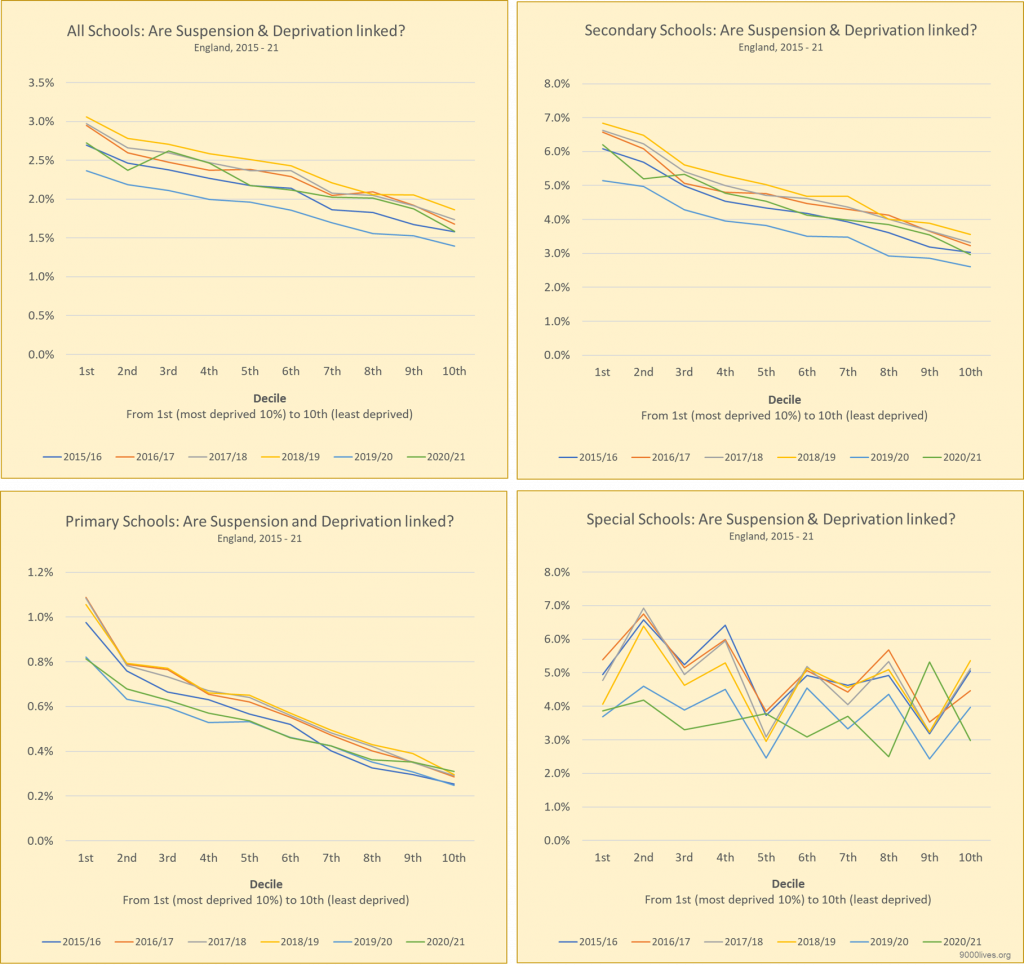
There is an explicit link between deprivation and suspension, although this is less clear in special schools,
7. Long Term Trends
The number of suspensions have been rising since 2015. The number of suspensions are currently at a 16 year high. It wasn’t always this way, they had been slowly declining from 2006 until 2014.
A similar pattern (falling until 2014 and then rising from 2015 onwards) is repeated for the number of permanent exclusions.
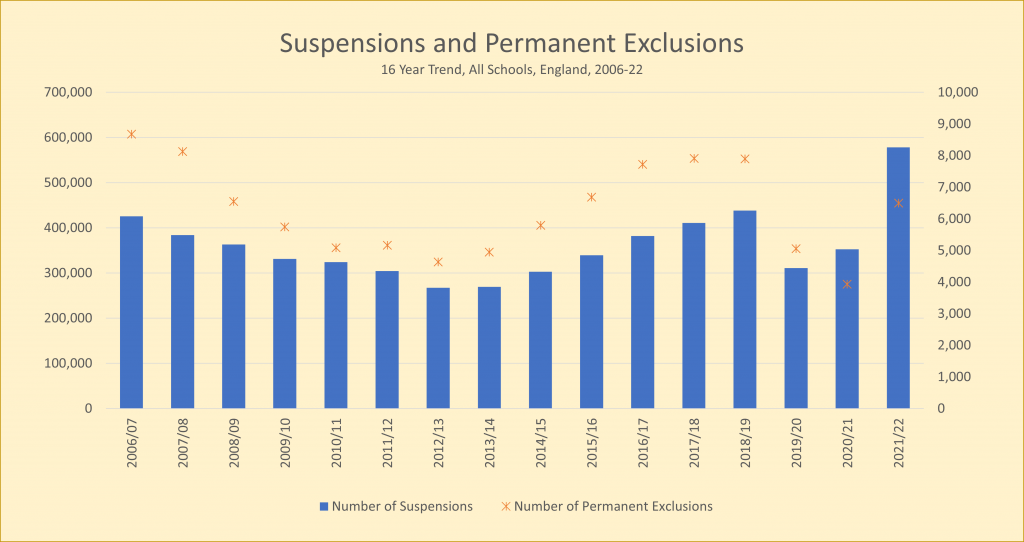
What’s more, the rates of suspension and exclusion also follow this pattern so the trend can’t be only because of any increase / decrease in the school population size.
Conclusion
When compared to the last 16 years, England is at a high level of suspensions. The rise is not showing any sign of levelling off, rather it seems to be accelerating.
These rises affect some groups more than others. That is because we suspend a higher rate of:
- Boys
- Y9s and Y10s
- Pupils who are more disadvantaged
No one has all the answers. The idea of suspensions isn’t bad: Sooner or later, all head teachers will be faced with the tough decisions to suspend pupils. But, the data does pose some legitimate questions, such as:
- Is suspension becoming normalised?
- How many pupils would we suspend before it is ‘too high?’
- When should we expect strict behaviour policies to have an impact which shows in the data?
School Suspensions and Exclusions: Summer 2024 Update
Here’s a cool tool we designed – you can use it to see how your school compares to others across the local authority, region or country.
9000 Lives Out of School Comparison tool (22-23)
It also you to see how your academy trust compares to others and it has snippets of good news (e.g. the % of primary schools that didn’t need to suspend any children for their behaviour).
You might also like to read
References:
- All graphs and charts are from DfE data: explore-education-statistics.service.gov.uk/find-statistics/permanent-and-fixed-period-exclusions-in-england
- Image credits: 9000 Lives
- Image credit (header image): Unsplash
Need help with inclusion in your organisation or school?
- Check out our feedback or get in touch.
Keep up to date with inclusion
- 𝕏 @9000Lives_org
- BlueSky @9000lives.org
